ASYNC_NETWORK_IO Wait Type In SQL Server

Like the ASYNC_IO_COMPLETION wait type, ASYNC_NETWORK_IO pertains to throughput; however, it focuses on the throughput of the network connection between your SQL Server instance and its clients, rather than the storage subsystem. It's important to note that ASYNC_NETWORK_IO waits are normal and do not necessarily indicate a network issue, as these waits can occur even when querying the SQL Server instance directly on the server.

What is the ASYNC_NETWORK_IO Wait Type?


Async_Network_Io Wait Type SQL Server 5

ASYNC_NETWORK_IO waits typically happen when client applications are unable to process query results quickly enough or when there are network performance issues. Most often, the former is the case, as many applications handle SQL Server results row-by-row or struggle with large data volumes, causing SQL Server to wait to send query results over the network. This waiting period is logged as the ASYNC_NETWORK_IO wait type. Additionally, ASYNC_NETWORK_IO waits can occur when querying remote databases via a linked server.

Sys.dm_os_wait_stats

You can check the ASYNC_NETWORK_IO wait type using the sys.dm_os_wait_stats DMV. We might not require a complicated environment to test the ASYNC_NETWORK_IO wait type.

Before running the DMV, lets clear the information from the DMV with a simple DBCC command. 

use master
go
DBCC
 SQLPERF('sys.dm_os_wait_stats', CLEAR);

Once the information is cleared from the DMV, lets run a simple SELECT statement from the SQL Server instance using SSMS.

select  * from DBA_Async_Test

Async_network_io Wait Type SQL Server 1

After querying from the above table, we can see a spike in the ASYNC_NETWORK_IO wait in the sys.dm_os_wait_stats.

select * from sys.dm_os_wait_stats where wait_type='Async_network_io'

Async_Network_Io Wait Type SQL Server 2

We saw a spike in the wait type because the SQL Server Instance was not able to get all the result in the SSMS as fast as the instance itself. When the instance is not able to get the results fast on to the SSMS, we start to see more of this wait type.

How To Lower ASYNC_NETWORK_IO Waits?

The answer is pretty simple. To lower ASYNC_NETWORK_IO Wait, we just must modify the query by limiting the result set as much as possible. Let’s look at the simple example as to how we can lower the wait type.

We will be clearing the wait stat information from sys.dm_os_wait_stats again to record the reading one more time.

use master
go
DBCC
 SQLPERF('sys.dm_os_wait_stats', CLEAR);

This time, we will be limiting the records from to take to just TOP 100.

select  TOP 100 * from DBA_Async_Test

Async_Network_Io Wait Type SQL Server 3

If you notice that the ASYNC_NETWORK_IO wait has been minimized. The SSMS was able to get the results fast enough and had not to wait for the completion of the query for longer duration. We can also reduce the ASYNC_NETWORK_IO wait by adding WHERE conditions to our query.

Note: If you still think that the above test case failed in your scenario, then please check the network configuration. At times, there are possibilities that the network configuration as well can slow down fetching the result sets.

We can check the network configuration by opening the task manager and navigating on to the “Ethernet” option.

Async_Network_Io Wait Type SQL Server 4

If you observe high network utilization along with increased ASYNC_NETWORK_IO wait times, the network might be the bottleneck. In such instances, consulting your network administrator could be beneficial. Network configurations are complex, involving various components such as switches, routers, firewalls, network cables, drivers, firmware, and possibly virtualized operating systems. Each of these elements can impact network throughput and contribute to ASYNC_NETWORK_IO waits.

Bottomline

ASYNC_NETWORK_IO waits happen when an application requests query results from a SQL Server instance over the network and is unable to process the returned results quickly enough. While these waits are generally normal, unusually high wait times might indicate changes in query results or network issues. To reduce application related ASYNC_NETWORK_IO wait times, consider decreasing the number of rows and/or columns returned to the application.

You may also refer : 

ASYNC_IO_COMPLETION Wait Type In SQL Server

FIX –‘ The specified @proxy_name ('Cmd_Exec') does not exist.’ In SQL Server

I was working on a client project to move the database jobs from one server to another. While we were in the middle of the job migration, one of the job prompted an error saying –‘ The specified @proxy_name ('Cmd_Exec') does not exist.’ Once I found the solution and fixed in the production, I wanted to share the same fix on my blog as well so that all of us are aware of this simple fix.

The CmdExec is a feature by Microsoft to define executable program or operating system command by using SQL Server Management Studio. My client had a job step that was executing the powershell script. That same step was generating the error for them. 

However, for more details on CmdExec, please refer to this document.

How to fix “The specified @proxy_name(‘Cmd_Exec’) does not exist”?

I am sure that, when you had received the error message, the respective credentials were not present. Please see the image below of my sample credential.

Steps to fix the error:

1. To fix the error, navigate to the credentials option (Expand Instance --> Security --> Credentials) in your SSMS.

Proxy Creation SQL Server 1

2. Create the credential. In my case, I have created MyCreds as the credential name and tagged MyCred_Login as the identity. Set a password for the credential you are creating.

Credential Creation SQL Server 2

3. Now, navigate to the proxies option (Expand SQL Server Agent --> Proxies --> Operating System (CmdExec)) in your SSMS.

Proxy Creation SQL Server 2

4. Create a new proxy either by using the GUI or through script. The SQL Server uses sp_add_proxy system stored procedure to create the proxy internally.

Proxy Creation SQL Server 3

Creating Proxy using script:

USE [msdb]
GO
EXEC msdb.dbo.sp_add_proxy @proxy_name=N'Cmd_Exec',@credential_name=N'MyCreds',@enabled=1
GO
EXEC msdb.dbo.sp_grant_proxy_to_subsystem @proxy_name=N'Cmd_Exec', @subsystem_id=3
GO
EXEC msdb.dbo.sp_grant_proxy_to_subsystem @proxy_name=N'Cmd_Exec', @subsystem_id=12
GO

Once the above steps are followed and your credential and proxies are set right, the SSMS will no longer give the error message. 

Bottomline

Cmd_Exec error gets generated when any job step has an execution command either at the operting system level or powershell. Following the above steps can get rid of the error message. 

ASYNC_IO_COMPLETION Wait Type In SQL Server

The ASYNC_IO_COMPLETION wait type is commonly encountered by a database administrator. It occurs every time SQL Server performs a file-related action at storage level and waits for it to complete. As the wait type is related to storage, you might encounter more often when a backup happens. However, if you encounter the ASYNC_IO_COMPLETION wait type.

What is the ASYNC_IO_COMPLETION Wait Type?

The ASYNC_IO_COMPLETION wait type occurs when a task is waiting for storage-related action to complete. In general, this wait type is more seen while a backup is happening in your server. The SQL Server monitors the signal from the storage subsystem for faster completion. In case of a delay from the storage side, the ASYNC_IO_COMPLETION wait type occurs. To be simpler, the faster your storage subsystem, the lower you see the ASYNC_IO_COMPLETION wait type.

ASYNC_IO_COMPLETION Wait Type

If you are seeing this wait type in your server, it means that your SQL Server task is communicating with the storage subsystem and there should not be any matter of concern. It generally flags the wait type when a database creation or a database backup operation takes place. You should take the wait type into consideration when the wait times are higher than the baseline measurements.  

Sys.dm_os_wait_stats

You can check the ASYNC_IO_COMPLETION wait type using the sys.dm_os_wait_stats DMV.

Before running the DMV, lets clear the information from the sys.dm_os_wait_stats DMV using a simple DBCC command.

use master
go
DBCC SQLPERF('sys.dm_os_wait_stats', CLEAR);

I will now run a full backup in my server. As soon as I execute the full backup, the information gets loaded into the DMV.

select * from sys.dm_os_wait_stats where wait_type='ASYNC_IO_COMPLETION'

ASYNC_IO_COMPLETION Wait Type SQL Server


How to Lower ASYNC_IO_COMPLETION Wait Type?

In most cases, high ASYNC_IO_COMPLETION wait is due to a database backup. To find if the wait type was because of a backup, then query the DMV with other backup waits.

select * from sys.dm_os_wait_stats  where wait_type
in ('ASYNC_IO_COMPLETION', 'BACKUPIO','BACKUPBUFFER') 

ASYNC_IO_COMPLETION Wait Type SQL Server 3


You can also try to lower the ASYNCH_IO_COMPLETION waits by configuring instant file initialization. Instant file initialization is a feature introduced by Microsoft for Windows 2003 to speed up the disk space allocation.

Bottomline

The ASYNC_IO_COMPLETION wait type is triggered by actions related to the storage subsystem within your SQL Server instance, such as database backups and new database creation. While these waits are generally normal, unusually high wait times can suggest storage issues. Before involving your storage administrator, confirm there is a true performance issue. One way to do this is by checking storage latency, as high latency can increase ASYNC_IO_COMPLETION wait times. Also, verify if the increased wait times coincide with database backups. Enabling instant file initialization by adding your SQL Server service account to the Perfmon volume maintenance tasks local policy can help reduce ASYNC_IO_COMPLETION wait times.

You may also refer:

BACKUPBUFFER Wait Type In SQL Server

Automatic, Planned, And Forced Failover Sequence Of Actions In SQL Server

This article covers the sequence of actions the Always-On high availability takes when the primary replica goes offline. When a primary replica goes offline, the failover target assumes the primary role, recovers its databases, and brings them online as the new primary databases. When the former primary replica becomes available, it switches to the secondary role, and its databases become secondary databases.

Let's look at the three types of failover:

  • Automatic failover (without data loss)
  • Planned manual failover (without data loss)
  • Forced failover (with possible data loss)

You can check the below table that summarizes the supported failover types under various availability and failover modes. For each pair of availability replicas, the effective availability and failover mode is determined by the combination of the modes of the primary replica and one or more secondary replicas.

Failover Sequence Of Action Always On SQL Server

Automatic Failover Internal Actions

To enable automatic failover, the conditions outlined in the table with common topologies must be met. An automatic failover triggers the following sequence of actions:

  • The state of the primary databases is changed to DISCONNECTED if the primary replica is still running, and all clients are disconnected.
  • The secondary database rolls forward any log entries waiting in the recovery queue.
  • At this point, the secondary replica becomes the new primary replica, and its databases become the primary databases. Immediately the new replica rolls back uncommitted transactions. Rollback occurs in the background while clients continue to use the database. As part of the internal process by the Always-On, the committed transactions are not rolled back.
  • Until the secondary databases connect and resynchronize with the new primary database, they are marked as NOT SYNCHRONIZED. Before rollback recovery starts, secondary databases can connect to the new primary databases and quickly transition to the SYNCHRONIZED state.
  • When the original primary replica comes back online, it becomes the secondary replica, and its databases become secondary databases. It resynchronizes with the corresponding primary replica and databases. Once the databases have resynchronized, failover is possible again, but in the reverse direction this time.

Planned Failover Internal Actions

A planned failover triggers the following sequence of actions:

  • At first, the Windows Server Failover Cluster (WSFC) is notified in order to ensure that there are no any new user transactions occur on the original primary replica databases.
  • The database on the secondary replica rolls forward any logs waiting in the recovery queue.
  • Now, the secondary replica becomes primary replica, and the primary replica turns into secondary replica.
  • The new primary replica rolls back any uncommitted transactions and brings the databases online as the primary databases.
  • As part of the process, none of the committed transactions will be rolled back. Additionally, the database will remain marked as “NOT SYNCHRONIZED” until the secondary databases connect and resynchronizes with the primary replica database.
  • Once the new secondary replica comes online, it resynchronizes with the new primary replica databases. When everything is back online and synchronizing as before, it becomes eligible for the reverse failover. Meaning, from new primary replica to the old primary replica. 


Forced Failover Internal Actions


A forced failover triggers the following sequence of actions:

  • The WSFC sends a request to the primary replica to go offline, ensuring no new user transactions occur on the original primary databases.
  • The secondary database rolls forward any logs waiting in its recovery queue.
  • The secondary replica then becomes the new primary replica, while the original primary replica assumes the role of the new secondary replica.
  • The new primary replica rolls back any uncommitted transactions and brings the databases online as primary databases.
  • Until the secondary databases connect and resynchronize with the new primary database, they are marked as NOT SYNCHRONIZING. Committed transactions are not rolled back during this process.
  • When the original primary replica comes back online, it becomes the secondary replica, and its databases become secondary databases. It resynchronizes with the corresponding primary replica and its databases. After resynchronization, failover is possible again, but in the reverse direction.

Note: Force failover can be risky and can cause data loss. Perform forced failover only if you want to restore service to your availiability database immediately. 

You may also refer: Data Synchronization Modes In Always On In SQL Server

How A Forced Failover Can Cause Data Loss In SQL Server?

I was working with one my clients in Always-On and unfortunately in the process of fixing an error, one of the members in our team forcefully failed over Always-On availability group from one instance to another. There is a need to understand the risks associated with force failover as it can lead to data loss.

This occurs because the target replica may be unable to communicate with the primary replica, making it impossible to ensure that the databases are synchronized. Figure below illustrates how a forced failover can cause data loss on the primary replica and how this loss can extend to a secondary replica.

Forced Failover Data Loss In SQL Server

1. In the previous example, the primary replica's last hardened LSN is 100 before it goes offline, while the asynchronous secondary replica's LSN is 50.

2. After a forced failover, the secondary replica becomes the new primary and sets its last hardened LSN to 50.

3. When the old primary comes back online, its synchronization status is suspended.

4. If synchronization is resumed, the old primary will sync with the new primary, sending its last hardened LSN as 100. Upon finding the new primary's last hardened LSN is 50, it will roll back its transaction log to LSN 50 and start accepting transaction log blocks from the new primary from that point onward. Thus, data loss is propagated from the primary to the secondary replica if synchronization is resumed.

Refer the related articles -
Data Synchronization Modes In Always On In SQL Server
How Does A Synchronous And Asynchronous Secondary Replica Resynchronize With The Primary Replica?

How Does A Synchronous And Asynchronous Secondary Replica Resynchronize With The Primary Replica?

It is always annoying to see either of the replicas failing, be it a primary or a secondary. However, Always-On Availability Group has an excellent feature to cover us from the situation.

In this article, we will be covering as to how a synchronous or an asynchronous secondary replica resynchronizes with primary replica.

Synchronous And Asynchronous Secondary Resynchronization With Primary Replica


Synchronous Secondary Replica Resynchronizing With The Primary Replica

1. When the synchronous secondary replica goes offline, its status changes from Synchronized to 'Not Synchronizing.' Once this status change occurs, the primary replica stops waiting for an acknowledgment from the secondary that it has hardened a commit and begins treating it as an asynchronous replica. This ensures that commits on the primary replica are not delayed by an unhealthy synchronous secondary replica.

2. When the secondary replica is brought back online, it establishes a connection with the primary replica and sends its End of Log (EOL) Log Sequence Number (LSN) to the primary replica.

3. Upon receiving this, the primary replica begins sending the log blocks that were hardened after the EOL LSN to the secondary replica.

4. As the secondary replica starts receiving and hardening these log blocks, its status changes to Synchronizing. This indicates that the secondary replica is connected to the primary and is catching up, essentially functioning as an asynchronous replica.

5. The secondary replica continues to harden the log blocks, apply the hardened transactions with the REDO thread, and send this information back to the primary replica.

6. This process continues until the Last Hardened (LH) LSN of both the primary and secondary replicas match. Once they do, the status of the secondary replica changes to Synchronized, and the primary replica starts treating it as a synchronous replica.

7. The primary replica begins waiting for an acknowledgment from the secondary replica for the commit before informing the user that the transaction has been committed successfully.

Asynchronous Secondary Replica Resynchronize With The Primary Replica

1. When the asynchronous secondary replica goes offline, its status changes from Synchronizing to 'Not Synchronizing.' The primary replica responds in the same way.

2. Once the secondary replica is brought back online, it establishes a connection with the primary replica and sends its End of Log (EOL) LSN to the primary replica.

3. Upon receiving this, the primary replica begins sending the log blocks that were hardened after the EOL LSN to the secondary replica.

4. As soon as the secondary replica starts receiving and hardening these log blocks, its status changes to Synchronizing. This indicates that the secondary replica is connected to the primary and is catching up.

Refer - Data Synchronization Modes In Always On In SQL Server

Data Synchronization Modes In Always On In SQL Server

In this article we will learn about the data synchronization modes in Always On high availability. There are two modes of data synchornization - Synchronous commit and Asynchronous commit.

We've all heard the saying, "You can't have it all." For instance, you can't enjoy all the perks of single life and be married, or have a busy weekend and still get plenty of rest. Similarly, when choosing the right data synchronization mode for Always On Availability Groups, you must consider trade-offs and opportunity costs.

In synchronous-commit mode, the focus is on high availability rather than performance, resulting in increased transaction latency. The primary replica waits to confirm the transaction to the client until the secondary replica has written the log to disk.

In asynchronous-commit mode, the priority is minimizing transaction latency at the expense of high availability. The primary replica confirms the transaction to the client right after logging the record locally, without waiting for any secondary replicas.

As a wise person once said, "The bad news is you can't have it all. The good news is that when you know what's truly important, you don't want it all anyway."

Synchronous-Commit Mode


Synchronous Commit Mode

Data synchronization in synchronous-commit mode works as follows:

1. A client initiates a transaction against the database in the availability group on the primary replica.

2. The primary replica generates transaction log blocks. Concurrently, the secondary replica requests the log blocks from the primary, negotiating the appropriate log sequence number (LSN) starting point and other necessary information. The primary replica’s log cache fills with these log blocks.

3. When the log block is full or the primary replica commits the operation, the log blocks from the log cache are flushed to the log file for persistence. In an Always On Availability Group setup, these log blocks are also copied to the log pool as they are flushed to the disk on the primary replica.

4. A thread called log capture reads the log blocks from the log pool and sends them to the secondary replica. For multiple secondary replicas, there is one log capture thread per replica, ensuring parallel log block transmission across replicas. The log content is compressed and encrypted before being sent to the secondary replicas.

5. On the secondary replica, a thread called log receive obtains the log blocks from the network.

6. These log blocks are written to the log cache on the secondary replica.

7. A redo thread, one per database, constantly runs on the secondary replica. As the log blocks are written to the log cache, the redo thread reads these blocks and applies the changes to the data and index pages in the secondary database to synchronize it with the primary replica. When the log block on the secondary replica is full, or upon receiving a commit log record, the content of the log cache is hardened onto the log disk on the secondary replica.

8. If the secondary replica is configured for synchronous mode, it acknowledges the commit to the primary node, indicating that the transaction is safely hardened, and the user can be informed that the transaction is committed. This ensures no data loss in case of a failover since the log is hardened on the secondary.

9. The redo thread operates independently of the log block generation on the secondary and their copying and persistence. If the redo thread is a few minutes behind, it may not find the log blocks in the log cache and will instead retrieve them from the log disk, as illustrated by the dotted line in the diagram above.

Asynchronous-Commit Mode


Asynchronous Commit Mode

Data synchronization in Asynchronous-commit mode works as follows:

1. A client initiates a transaction against the database in the availability group on the primary replica.

2. The primary replica generates transaction log blocks. Concurrently, the secondary replica requests the log blocks from the primary, negotiating the appropriate log sequence number (LSN) starting point and other necessary information.

3. When the log block is full or the primary replica commits the operation, the log blocks from the log cache are flushed to the log file for persistence. In an Always On Availability Group setup, these log blocks are also copied to the log pool as they are flushed to the disk on the primary replica.

4. If all secondary replicas are in asynchronous availability mode, a successful I/O to the local transaction log is sufficient to send an acknowledgment of a successful commit back to the application. Simultaneously, a thread called log capture reads the log blocks from the log pool and sends them to the secondary replica. For multiple secondary replicas, there is one log capture thread per replica to ensure parallel transmission. The log content is compressed and encrypted before being sent to the secondary replicas.

5. A thread called log receive runs on the secondary replica, receiving the log blocks from the network and writing them to the log cache.

6. The log blocks are written to the log cache on the secondary replica.

7. A redo thread constantly runs on the secondary replica. As the log blocks are written to the log cache, the redo thread reads these blocks and applies the changes to the data and index pages in the secondary database, synchronizing it with the primary replica. When the log cache on the secondary replica is full or receives a commit log record, it hardens the content onto the log disk on the secondary replica.

8. The redo thread operates independently of the log block generation and copying on the secondary replica. If the redo thread lags by a few minutes, it may not find the log blocks in the log cache and will instead retrieve them from the log disk, as indicated by the dotted line in the diagram.

Note: 
Starting with SQL Server 2016, the synchronization throughput of Availability Groups has increased approximately tenfold due to enhancements in the data synchronization process. These improvements include parallel and faster compression of log blocks on the primary replica, an optimized synchronization protocol, and parallel decompression and redo of log records on the secondary replica. In SQL Server 2012 and 2014, the redo process was executed serially by a single thread, limiting it to a single CPU core. This caused secondary replicas to struggle with high-write workloads, leading to long downtimes during a failover. In SQL Server 2016, the redo process is executed in parallel, utilizing all available CPU cores. These enhancements have improved database recovery times on failover and increased the data freshness on secondary replicas.

What Is Change Data Capture In SQL Server?

I was working on a project where we had to record the activities on a database when tables or rows get modified. We thought about Microsoft's feature called the Change Data Capture in short called as CDC in SSMS. 

What is Change Data Capture (CDC)?

Change Data Capture (CDC), first introduced in SQL Server 2008, is a valuable feature that tracks and captures changes made to SQL Server database tables without requiring additional programming efforts. Initially, CDC could only be enabled on databases in the SQL Server Enterprise edition, but starting with SQL Server 2016, this restriction was removed.

CDC monitors INSERT, UPDATE, and DELETE operations on database tables, recording detailed information about these changes in mirrored tables. These mirrored tables have the same column structure as the source tables, with additional columns to describe the changes. For each INSERT operation, CDC writes a record showing the inserted values. For each DELETE operation, it writes a record showing the deleted data. For each UPDATE operation, CDC writes two records: one showing the data before the change and another showing the data after the change.

Enabling CDC On The Database

Before enabling the CDC for any table, we should enable the CDC at the database level by using sp_cdc_enable_db system stored procedure. Any DBA working on this enable/disable should have a sys admin permission.

USE SQLArena_CDC;
GO
EXEC sys.sp_cdc_enable_db;
GO

Now we can check if the CDC has been enabled using sys.databases DMV.

Change Data Capture 1

Enabling CDC On The Table

After enabling CDC on the database, we can enable the CDC at the individual table level by using sp_cdc_enable_table system stored procedure. You can enable with the below command.

USE SQLArena_CDC;
GO
EXEC sys.sp_cdc_enable_table
    @source_schema = N'dbo',
    @source_name = N'dtproperties',
    @role_name = NULL;  -- or specify a role for access control
GO

Change Data Capture 2


Similarly, to make sure that the CDC has been enabled at the table level, use sys.tables DMV. 

Disabling CDC

To disable CDC, the command are similar to how we used for enabling CDC. First we will be disabling the CDC at the table level using below command.

USE SQLArena_CDC;
GO
EXEC sys.sp_cdc_disable_table
    @source_schema = N'dbo',
    @source_name = N'dtproperties',
    @capture_instance = N'dbo_dtproperties';  -- This is optional if you have a single capture instance
GO

Then disable the CDC at the database level. 

USE SQLArena_CDC;
GO
EXEC sys.sp_cdc_disable_db;
GO

Note: You can disable the CDC directly at the database level if you want to cut down a step.

Bottomline

CDC is a powerful feature for tracking changes to your data, but it’s essential to manage it properly to ensure your system's performance and integrity.

What Is A Temporary Table In SQL Server?

Temporary tables are commonly used by database developers and DBAs to store data temporarily. Temporary tables are also known as temp tables in SQL Server. We will be representing as temp table moving forward in this article. Temp tables are generally used for faster data retrieval and increased query performance. Let’s look deeper and learn about the temp tables in SQL Server.

What is a temp table in SQL Server?

The temp table is used to store data temporarily for faster data retrieval. It works like a normal table to perform select, insert, update, or delete commands. Temp tables are created with a prefix with either a single # or a double ##. Additionally, temp tables are automatically dropped when a session is closed in SQL Server.

Types of temp tables

There are two types of temp tables. Local temp table, and a global temp table.

Local temp tables

Local temp tables are created with a single # prefix on a table name. It means that the local temp tables are active and usable to the session that created them. No other user can access the temp table when the session is active upon creating a local temp table. However, if you are creating a local temp table within a stored procedure, the temp table will be dropped automatically.

Creating a temp table and working with DDL/DML commands.

create table #Temp_Table
(
[id] int,
[Hospital] varchar(100),
[Location] varchar(100)
)

insert into #Temp_Table
select 1, 'Apollo', 'New York'

Update #Temp_Table set Hospital = 'Apollo NY' where ID=1

Delete from #Temp_Table where ID=1

select * into #Temp_Table_2 from #Temp_table

drop table #Temp_table

Global temp table

Global temp tables are created with a double ## prefix on a table name. It means that the temp table is active and usable for other users as well. But the only protocol to follow is that the session that opened for creating the global temp table must be open and active for others to access. The moment the master session closes, the global temp table will be dropped, and other users lose access to the global temp table. 

create table ##Temp_Table
(
[id] int,
[Hospital] varchar(100),
[Location] varchar(100)
)

insert into ##Temp_Table
select 1, 'Apollo', 'New York'

Update ##Temp_Table set Hospital = 'Apollo NY' where ID=1

Delete from ##Temp_Table where ID=1

select * into ##Temp_Table_2 from ##Temp_table

drop table ##Temp_table


Where are the temp tables stored in SQL Server?

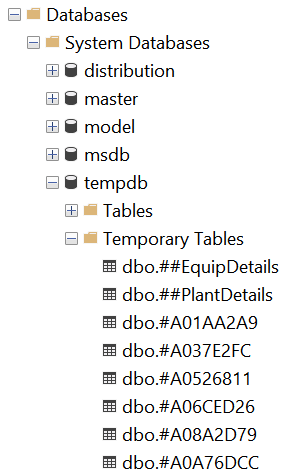
All the temp tables are stored in the tempdb. All the temp tables sit in the temporary tables folder under the tempdb.

Temporary Tables In SQL Server


Bottomline

Temporary tables are used for faster data retrieval. In many cases, temp tables come handy while optimizing a query. Both local and global temp tables will be stored in the tempdb. 

You may also refer: 
CTE in SQL server

HADR_LOGCAPTURE_WAIT And HADR_WORK_QUEUE Wait Type In SQL Server

The HADR_LOGCAPTURE_WAIT and HADR_WORK_QUEUE are waits related to AlwaysOn Availability Group. The AlwaysOn Availability Group concept was introduced in SQL Server 2012. It was introduced to replace database mirroring. The AlwaysOn wait types can be easily recognized by the HADR_ prefix. We will be looking into the HADR_LOGCAPTURE_WAIT and HADR_WORKQUEUE waits in detail.

What are the HADR_LOGCAPTURE_WAIT and HADR_WORK_QUEUE wait types?

The HADR_LOGCAPTURE_WAIT and HADR_WORK_QUEUE wait types are benign and occur naturally within the AlwaysOn configuration.

HADR_LOGCAPTURE_WAIT

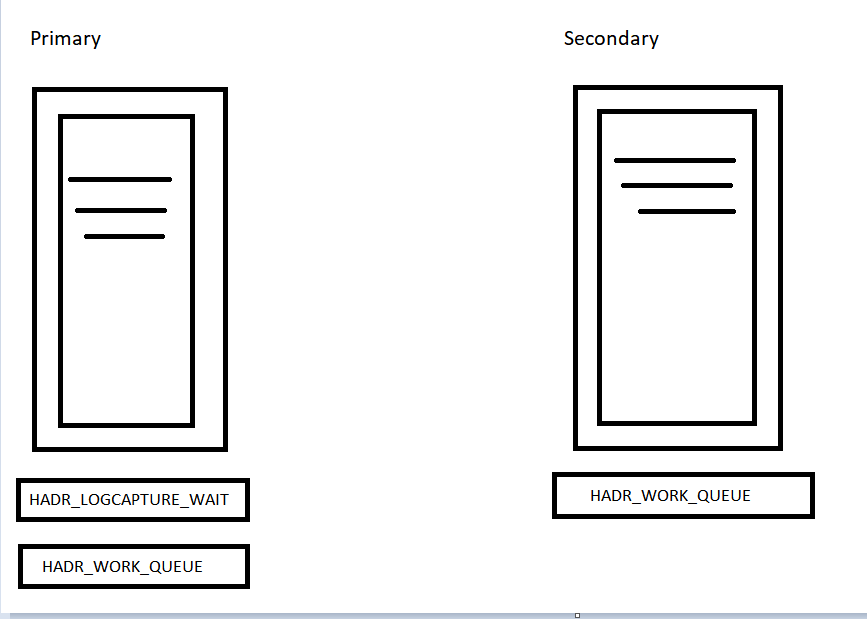
HADR_LOGCAPTURE_WAIT occurs when waiting for the log records to be available. We can encounter this wait type when new log records are generated by connections. Additionally, the wait type can be expected when the log scan is read from the disk. HADR_LOGCAPTURE_WAIT occurs in the primary database inside the AlwaysOn Availability Group. 

HADR_WORK_QUEUE

The HADR_WORK_QUEUE wait type occurs when the AlwaysOn Availability Group is waiting for a new worker thread to be assigned. This is an expected action by the AlwaysOn functionality. Additionally, the wait type is an indication of free threads waiting for work. 

HADR_LOGCAPTURE_WAIT and HADR_WORK_QUEUE 1


Sys.dm_os_wait_stats

You can check the HADR_LOGCAPTURE_WAIT and HARD_WORK_QUEUE wait type information from the DMV – sys.dm_os_wait_stats.

HADR_LOGCAPTURE_WAIT and HADR_WORK_QUEUE 2


Bottomline

Both HADR_LOGCAPTURE_WAIT and HARD_WORK_QUEUE wait types are good. They are natural to encounter if we have the AlwaysOn enabled servers. Having these wait types does not indicate a performance overhead. There is no attention needed in case you see these wait types.

More Wait Types For your reference:

What is REDO_THREAD_PENDING_WORK Wait Type?
What is HADR_SYNC_COMMIT Wait Type?